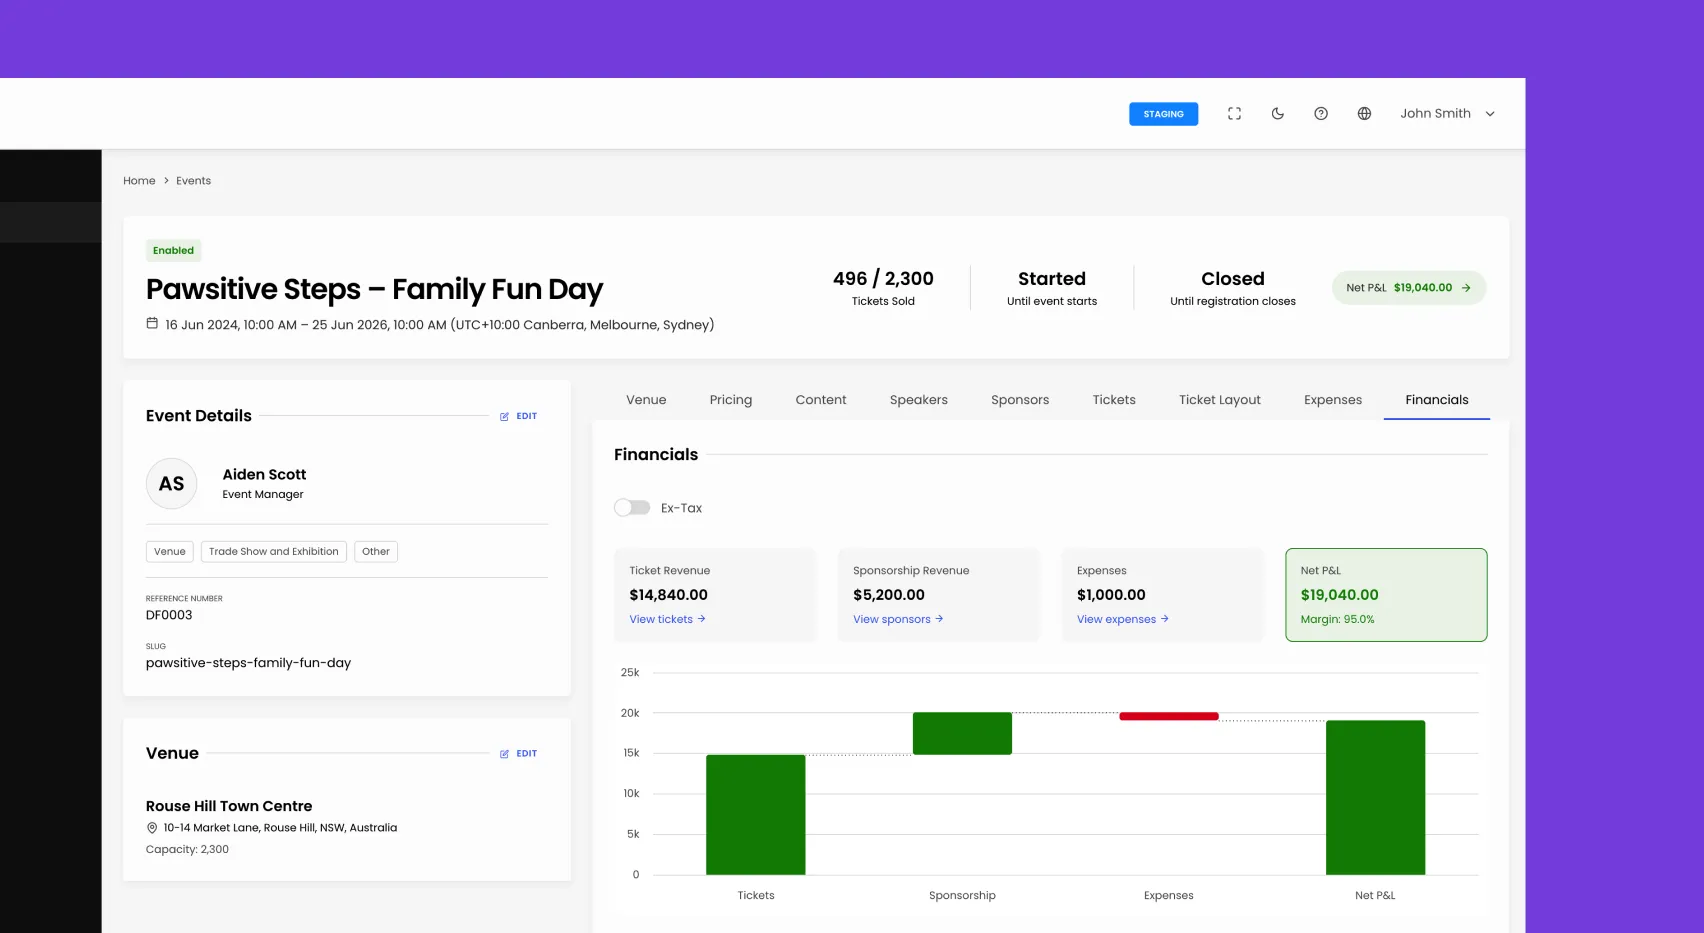
Before, you had to export numbers and calculate event earnings yourself. With Events v5.6.0, you can now see this information right in the product.
Revenue, Expenses, Net P&L, and Margin % are now default columns on the events list so that you can compare a whole season at a glance. A new Financials tab charts these figures in a Highcharts waterfall view. A Net P&L chip appears in the page header, and a per-user Ex-Tax or Gross toggle lets finance and operations read the numbers the way they need to.
The event detail page now uses an operations-first layout. The header has operational counters, summary cards for key figures, and a horizontally scrolling tab rail so the page can show more information without feeling crowded. The Details tab groups fields into logical sections, and the Reassign drawer now gives an archive path from its empty states.
Archiving, restoring, and reassigning pricing tiers now work again. The pricing division migration no longer loses data or fails if run twice, and we removed unused pricing field references from event_pricing_division GraphQL. Event imports no longer drop ticket prices or pricing divisions without notice. Datetime fields are now standardized to ISO 8601 UTC, and we now reject input without a timezone instead of assuming one.
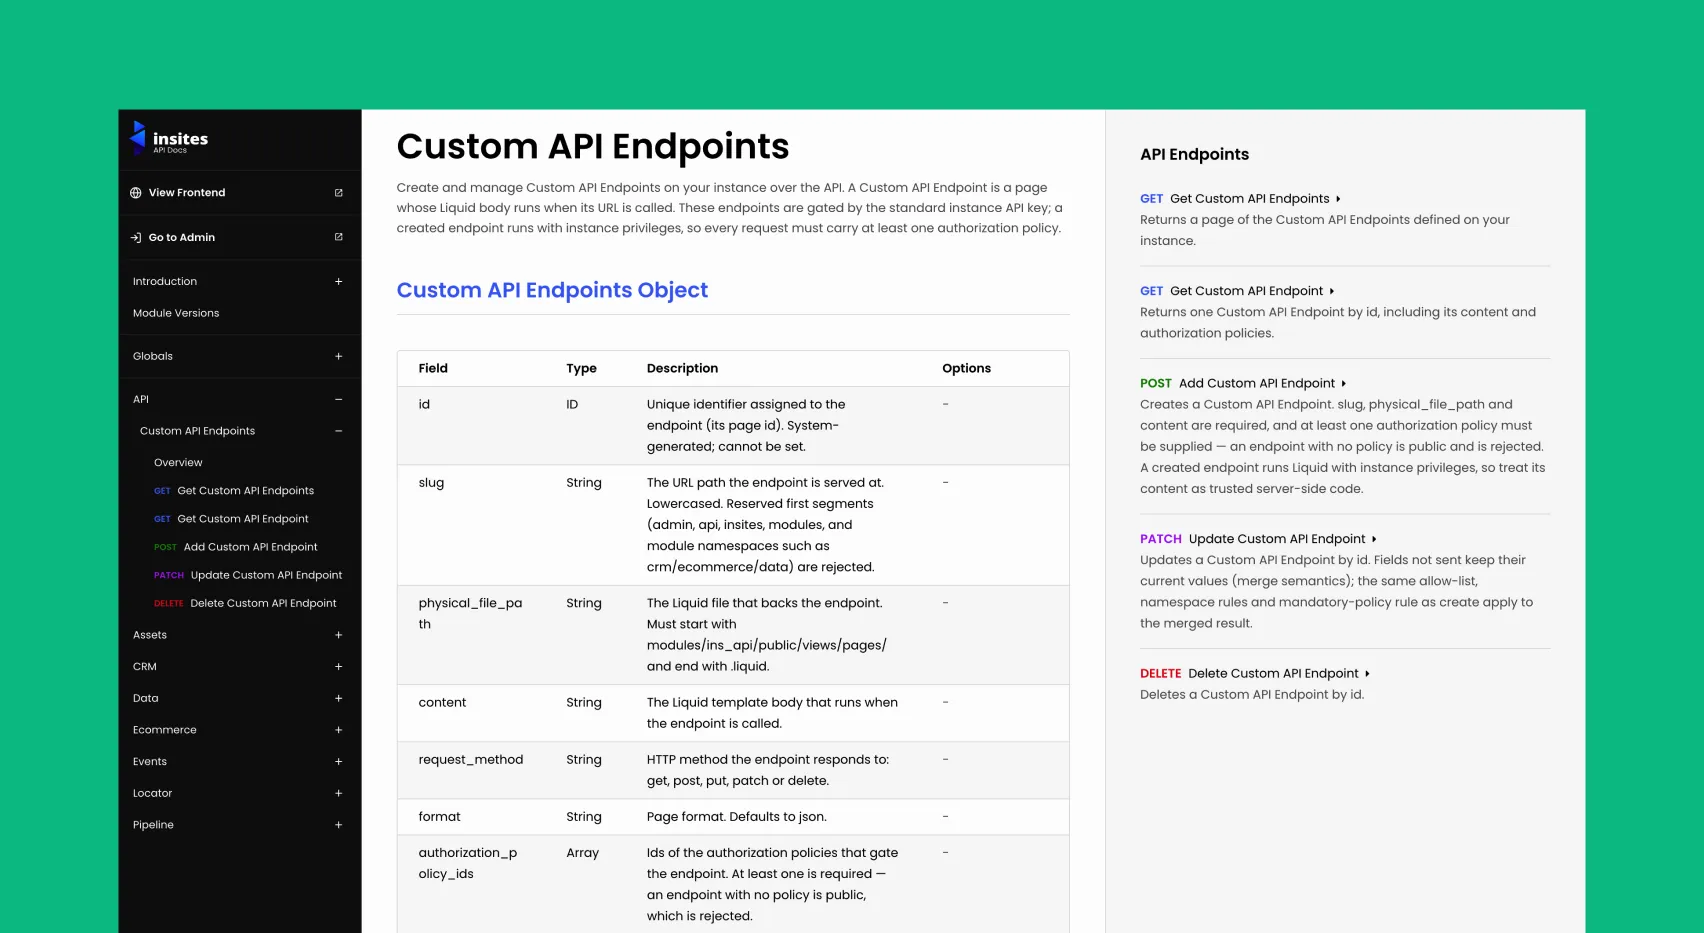
We fixed silent image upload failures and missing Android camera and gallery UUIDs. URL validation is now in place, and we hide link and password fields for venue events. Orphaned commas no longer appear in the PDF ticket venue address. We also fixed bugs related to time zones, pagination, and stale validation on the event detail page. Events API v2 examples now include IDs on nested object references and document the nested file keys for event uploads, galleries, speaker images, sponsor logos, and expense attachments.

Try Insites for as long as you like with our free starter plan and free staging instances.
Then purchase a production instance when you are ready to go live.